ConvLens · CNN interpretability
Visualize how CNNs transform images into predictions
Explore layer-by-layer activations, feature maps, and Grad-CAM visualizations to understand what CNNs learn.
How It Works
Understand the process from image upload to visualization
Step 1
Upload Image
Upload any image you want to analyze.
Step 2
CNN Processing
The CNN extracts features through multiple layers.
Step 3
Visualization
Explore feature maps and Grad-CAM heatmaps.
Step 4
Prediction
View the final prediction with confidence scores.
Step 1
Upload Image
Upload any image you want to analyze.
Step 2
CNN Processing
The CNN extracts features through multiple layers.
Step 3
Visualization
Explore feature maps and Grad-CAM heatmaps.
Step 4
Prediction
View the final prediction with confidence scores.
What You'll See
Explore every layer of a CNN's decision-making process
Feature Maps
See what each layer focuses on as the network processes your image through different levels of abstraction.
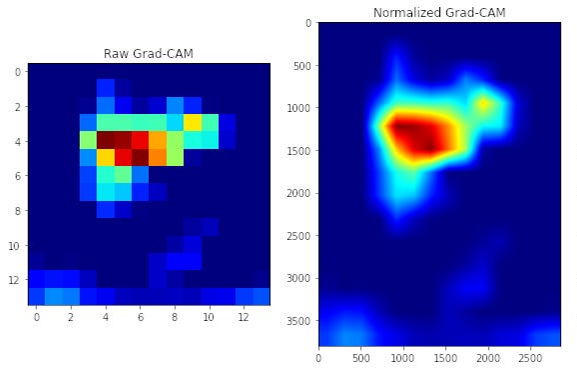
Grad-CAM
Understand why the model predicted that class with heatmap visualizations showing the most important regions.
Prediction Breakdown
Track confidence scores and explore the top predicted classes with detailed probability breakdowns.
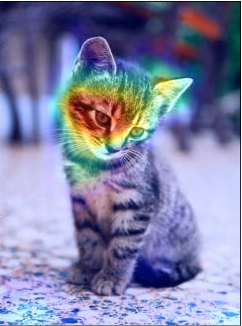
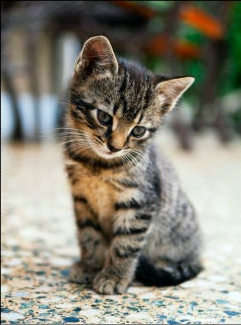
Example CNN Explanation
See how a CNN transforms an image: from the original photo, through Grad-CAM heatmaps, to the final overlay visualization.
Not sure which model to use?
Compare all 11 architectures on one chart. See the accuracy, speed, and size tradeoffs side by side — and pick the right model for your task in seconds.
Try it yourself
Pick a model, upload an image, then run analysis in one step
Choose a model
Upload image
Click to upload or drag and drop
PNG, JPG, GIF up to 10MB